Monitoring jobs
The queue is the operator landing page. The job detail page, the workers page and the activity feed cover the rest; each view answers a distinct class of question.
A distributed encode has more failure points than a local one. The console is designed so that each failure is visible in a specific view rather than buried in a log. This page describes which view to consult for each class of question.
Queue#
The queue at /queue is where the console opens after sign-in; there is no separate dashboard page. It lists work, one row per job, newest first, with state-count chips for filtering, a free-text filter, and the Submit button. For most jobs it is the only view required.
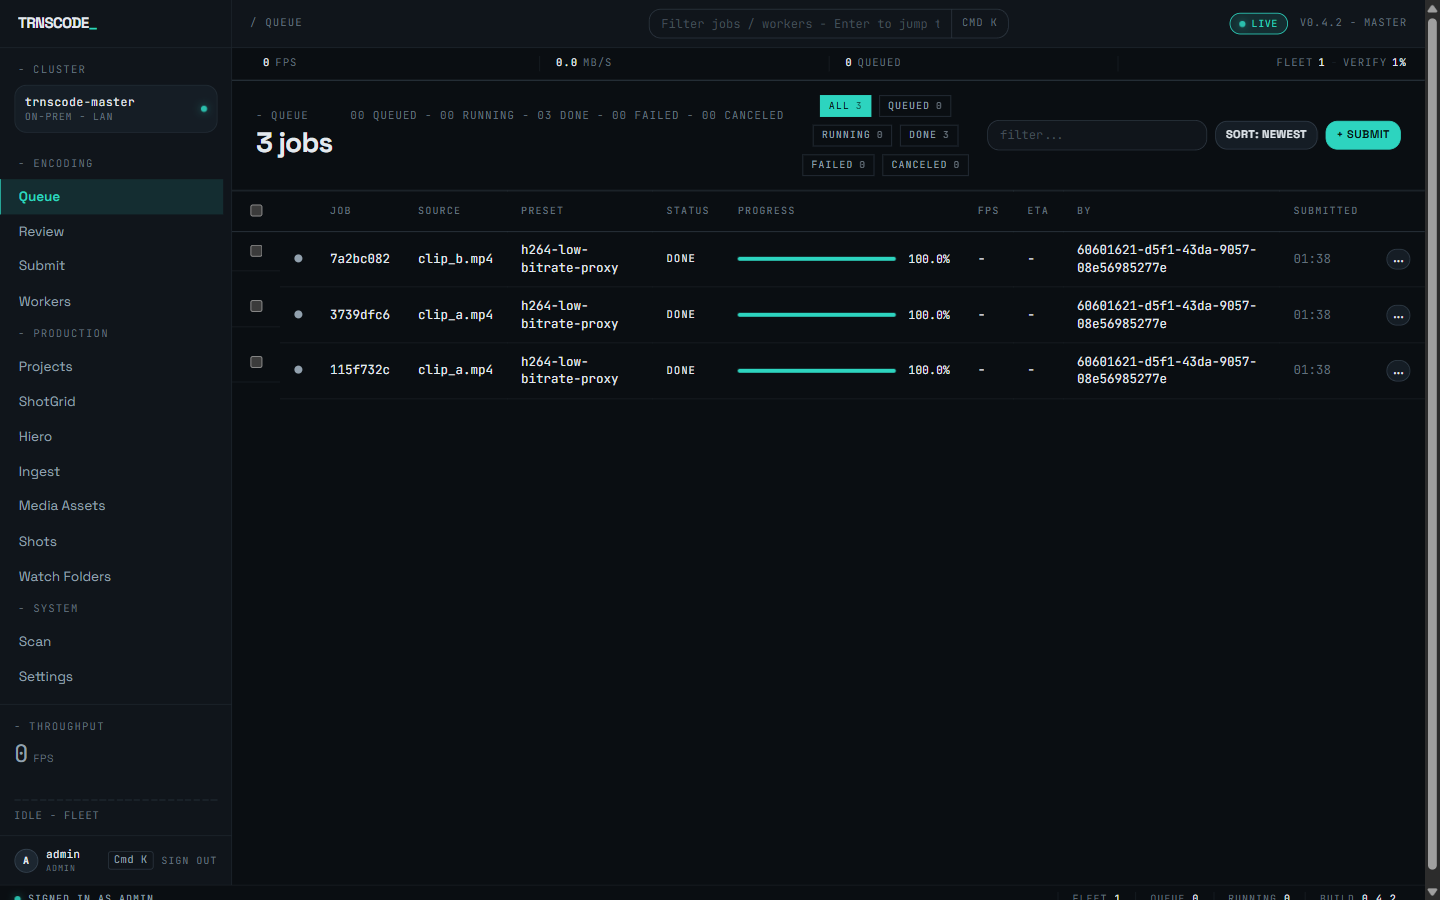
Clicking a row opens that job's detail page at /jobs/<job-id> — see Job detail. Everything about a single job lives on that page.
Progress arrives over a persistent connection: running jobs update in place as work happens. Refreshing the page is not required and does not accelerate updates.
Jobs can be acted on from the queue: cancel a job that is wrong, retry one that failed. Selecting several jobs applies the same action to the selection — for example, cancelling forty unwanted jobs queued by a misconfigured watch-folder rule.
Cancelling stops the assignment of new chunks. Chunks already running on a worker finish first; the encoder is a separate process, and terminating it mid-write would leave a partial file. Expect a short delay between cancelling and the job settling.
Cluster metrics#
Fleet-level state is visible from every page rather than on a page of its own. Two surfaces carry it.
- The sidebar throughput widget. The Throughput area of the left sidebar shows the live cluster frame rate with a rolling sparkline and a held Mb/s reading, and states whether the fleet is idle or live.
- The meta-strip. The strip across the top of every page shows live cluster KPIs: frames per second, Mb/s, jobs queued, fleet machines online, and the proportion of jobs passing verification.
Use these to determine whether anything is currently wrong at the system level. The queue answers questions about a job; the workers page answers questions about a machine; the meta-strip and throughput widget answer questions about the whole system.
Prometheus metrics#
The master exposes a Prometheus endpoint at /metrics in the standard text format, so the fleet can appear on a monitoring wall alongside everything else a facility runs. It reports counts of workers, jobs and chunks by state and the queue depth, plus live fleet throughput (frames per second and Mb/s), the 24-hour verification pass ratio, the average chunk duration, a chunk-failure counter labelled by failure category, and a build_info series carrying the version and build fingerprint. A license_read_only gauge makes a licensing problem visible on a dashboard rather than as a support call.
The endpoint is unauthenticated, so a scraper need not carry a session token. Do not expose it directly to an untrusted network — front it with basic authentication at a reverse proxy. Its labels are deliberately low-cardinality (worker, state, failure category, preset) and never include a job or chunk id, so a large job cannot flood the monitoring system with series.
Job detail#
Each job has a page at /jobs/<job-id>, opened by clicking the job's queue row. The page is two panes: the main column carries a progress hero — the completion percentage with live FPS, bitrate, speed and ETA readouts, and the Cancel action — above a tab bar; the right rail lists the assigned workers and the effective spec.
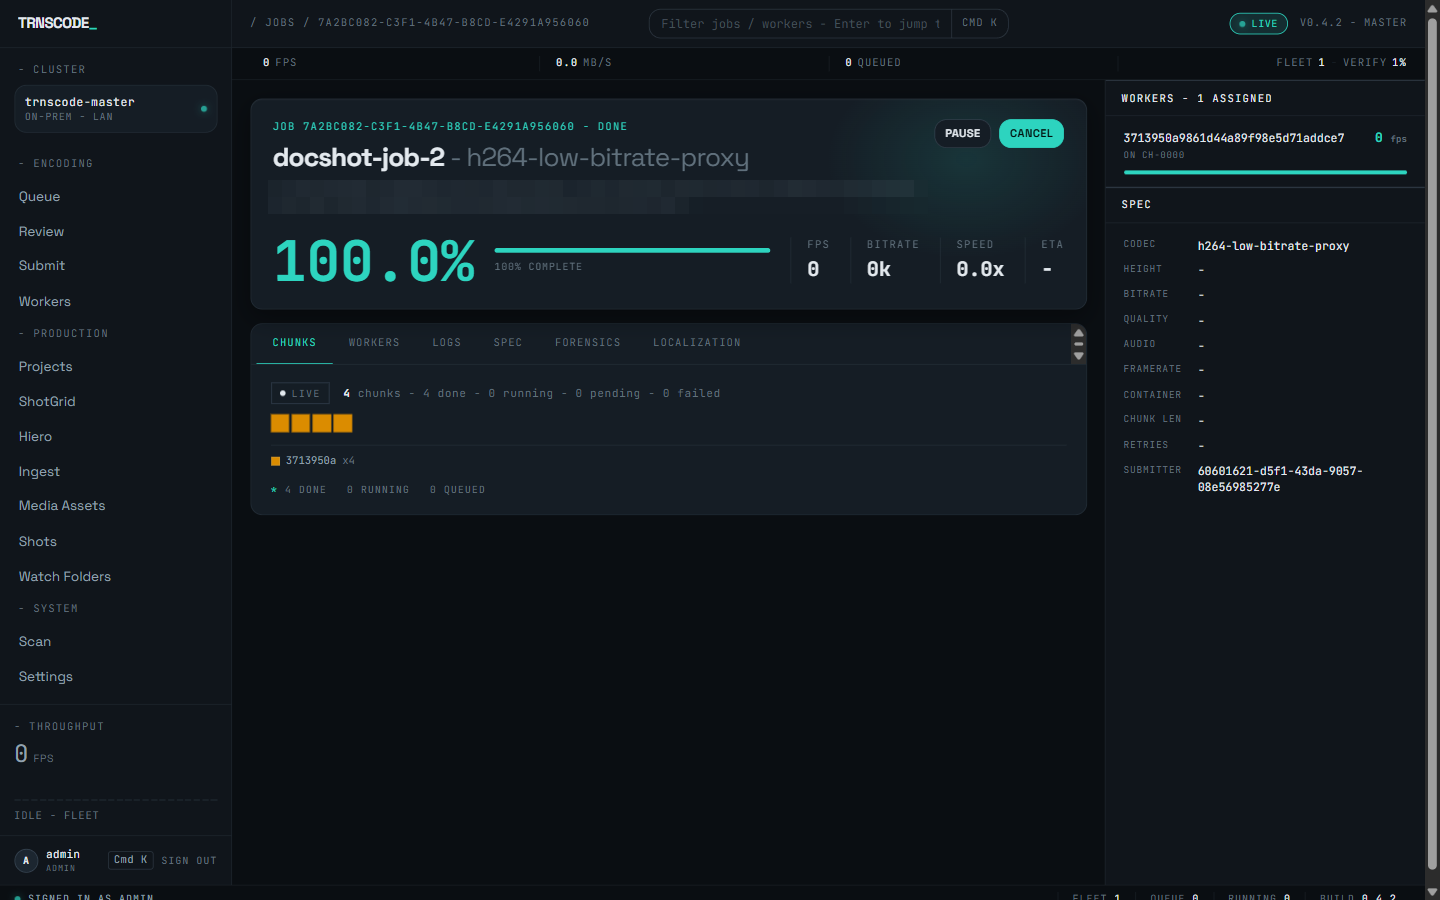
The tabs are Chunks, Workers, Logs, Spec and Forensics; localization jobs add a Localization tab carrying per-territory evidence. The Spec tab shows the effective encode specification, including any per-job overrides.
Chunk matrix#
The Chunks tab shows the chunk matrix: one cell per chunk, coloured by the worker that owns it. It is the fastest way to verify that distribution is behaving as expected.
Each worker is assigned a stable colour derived from its identity, so the same machine appears in the same colour every time — across jobs and across sessions.
| Cell | State | Meaning |
|---|---|---|
| Empty outline | QUEUED | Planned, not yet given to a worker. |
| Outlined in a worker colour | ASSIGNED | Handed to that worker, not yet started. |
| Solid, shimmering | RUNNING | Encoding now. The shimmer tracks progress. |
| Solid | DONE | Finished and accepted. |
| Diagonal hatch | FAILED | The encode failed. The chunk is retried on another worker. |
| Dashed outline | CANCELED | Abandoned deliberately. |
Chunk matrix patterns#
The overall pattern conveys more than any individual cell. Four patterns are common.
Working as intended. Every approved worker is taking chunks and finishing them at a rate proportional to its speed.
A single worker is doing all the work. Either the other workers are not approved, or they cannot produce what this preset requires. Check the workers page. This is a configuration problem rather than a performance one, and it is the most common cause on a new fleet.
The tail: one slow chunk on one slow worker now determines when the job finishes. Nothing is wrong; this is the fundamental limit of chunked encoding.
Chunks are failing and being retried. One or two failures are expected when a worker goes offline and its work is reassigned. A steady stream of failures from the same worker indicates a problem on that machine: a full disk, a broken accelerator, or an FFmpeg build that differs from the rest of the fleet.
A fully solid matrix does not mean the job is finished. After the last chunk completes, the master still joins the chunks, muxes the audio back in, and verifies the result. On a long source this takes measurable time; a job showing every cell solid but not yet complete is assembling, not stuck.
Workers page#
The workers page shows the fleet: every machine that has registered, its state, and its reported capabilities.
When a job is not distributing as expected, check three things here.
- Status. Only an approved, online worker receives chunks. A machine in the pending-approval state appears healthy from its own console but never receives work.
- Capabilities. Each worker reports the codecs and accelerators it found. A worker missing the codec a preset requires is correctly excluded; the scheduler treats capability as a hard constraint, not a preference.
- Last contact. A worker that has stopped heartbeating is transitioning to offline. Its in-flight chunk is reassigned.
The workers page is also where a machine is drained before being taken out of service. Draining stops new assignments while current work finishes, which is the difference between a clean removal and a reassigned chunk.
Activity feed#
The activity feed is the audit record. Every meaningful event — jobs submitted and completed, chunks assigned and failed, workers registering and being approved, verification results, preset fallbacks — lands there in order, with a live tail as events occur.
Selecting an event opens a drawer rendered for that event type. Job, chunk, worker, correctness, QC, localization, MAM, watch-folder and Flow events each render as a readable account of what happened, not a raw payload.
The activity feed answers why. The queue reports that a job failed; the activity feed reports that it failed verification because the assembled duration did not match the source. Use this record when an outcome must be explained.
Forensics tab#
The job detail page's Forensics tab carries four panels: Correctness — each verifier with its outcome and measured values; QC — loudness, true-peak and any video quality floors; Lineage — source fixity and a source-versus-output metadata comparison; and Chunk argv — the exact encoder command each chunk ran, with copy to clipboard.
Use this tab to confirm that a deliverable verified, and with which command. See Correctness & QC for how to read a result, including why a skipped check is neither a pass nor a failure, and Read job forensics for a worked example.
Console navigation#
Press ⌘K (or Ctrl-K) anywhere in the console to jump to a view, a job or an action by typing — including switching theme. On a busy fleet this is faster than navigating.
View selection#
| Information required | View |
|---|---|
| Whether a job has finished | The queue |
| Whether the fleet is busy | The meta-strip and the throughput widget |
| Whether a job is distributing across the fleet | The chunk matrix, on the job's Chunks tab |
| Why only one machine is working | The workers page |
| Why a job failed | The activity feed |
| The settings that produced a file | The job's Spec tab |