Read job forensics
Open a completed job's detail page and read its verification evidence. The example shows a completed encode whose correctness report covers eleven verifiers.
This article shows where the evidence lives. For what each verifier establishes and how to interpret a pass, a skip and a fail, see Correctness & QC.
Open the job detail#
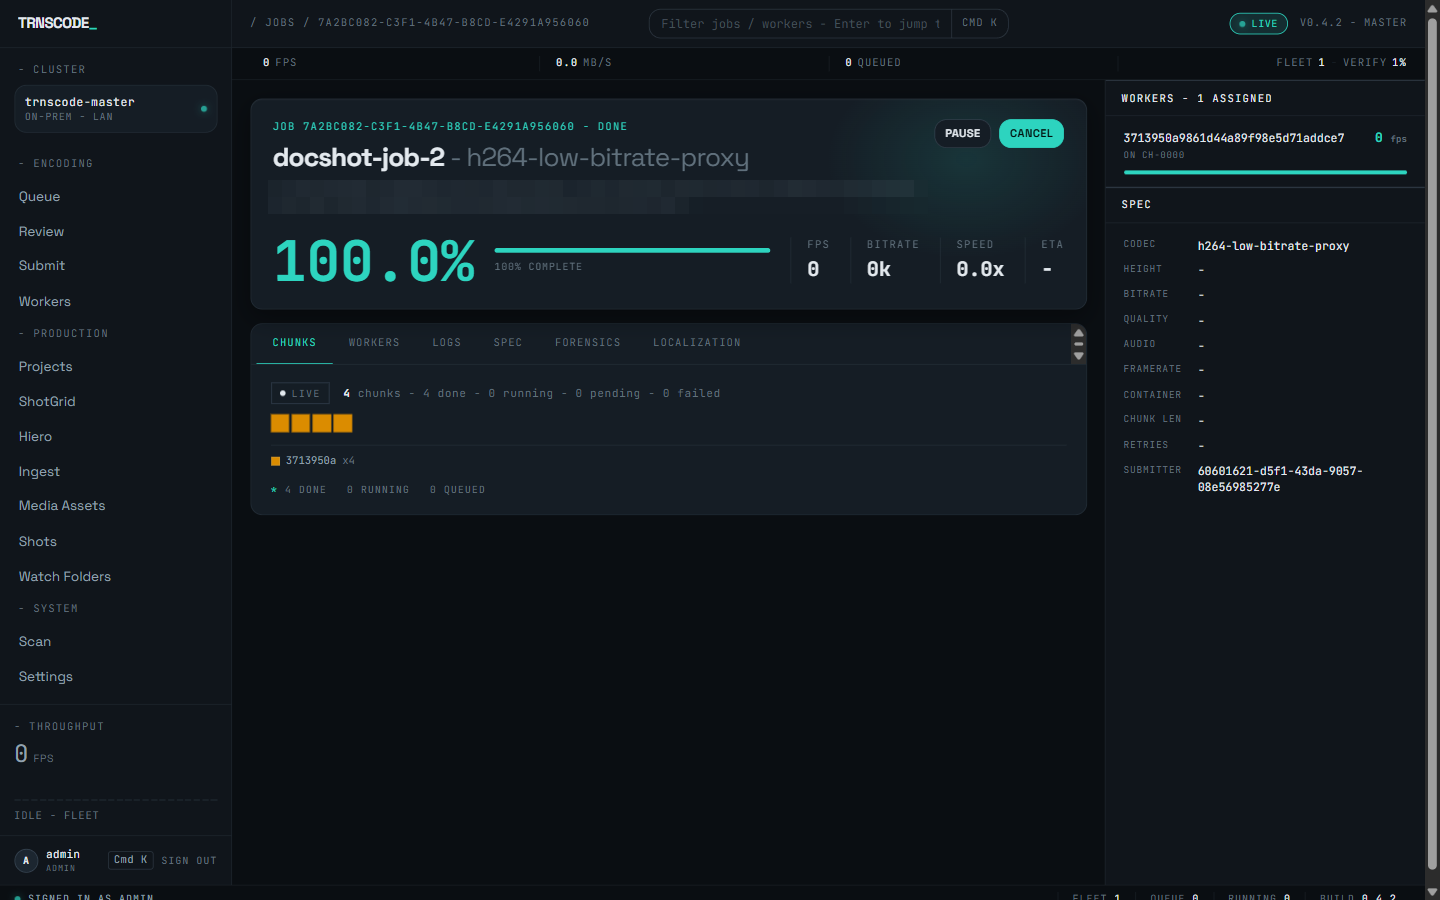
From the Queue, click a job's row. The detail page at /jobs/<job-id> opens with the progress hero — job id, status, preset, source path, the completion percentage with rate readouts, and the action buttons — above the tab bar, with the assigned workers and the spec in the right rail.
The detail tabs#
| Tab | Contains |
|---|---|
| Chunks | The chunk map and per-chunk state. |
| Workers | Which machines encoded this job. |
| Logs | The FFmpeg stderr the workers captured, per chunk — failed chunks first. |
| Spec | The effective encode specification, with any per-job overrides tagged. |
| Forensics | The Correctness, QC, Lineage and Chunk-argv panels. |
| Localization | Per-territory conformance evidence, for localization jobs. |
The Logstab is where a failed chunk's actual FFmpeg error lives. It lists the job's finished chunks — failed ones first — and shows the stderr each captured, expandable, with a copy action; it is the first place to look when a chunk failed and the reason is not obvious from the activity feed. Below 768 pixels it is the only place the stderr is reachable.
Read the Forensics tab#
Click Forensics. The tab carries four panels: Correctness lists each verifier with its outcome and the measured values it recorded — not only a pass mark; QC holds the loudness and true-peak report; Lineage records source fixity and a source-versus-output metadata comparison, and states when no comparison is available; Chunk argv shows the exact FFmpeg command each chunk ran, with a copy-to-clipboard action per command.
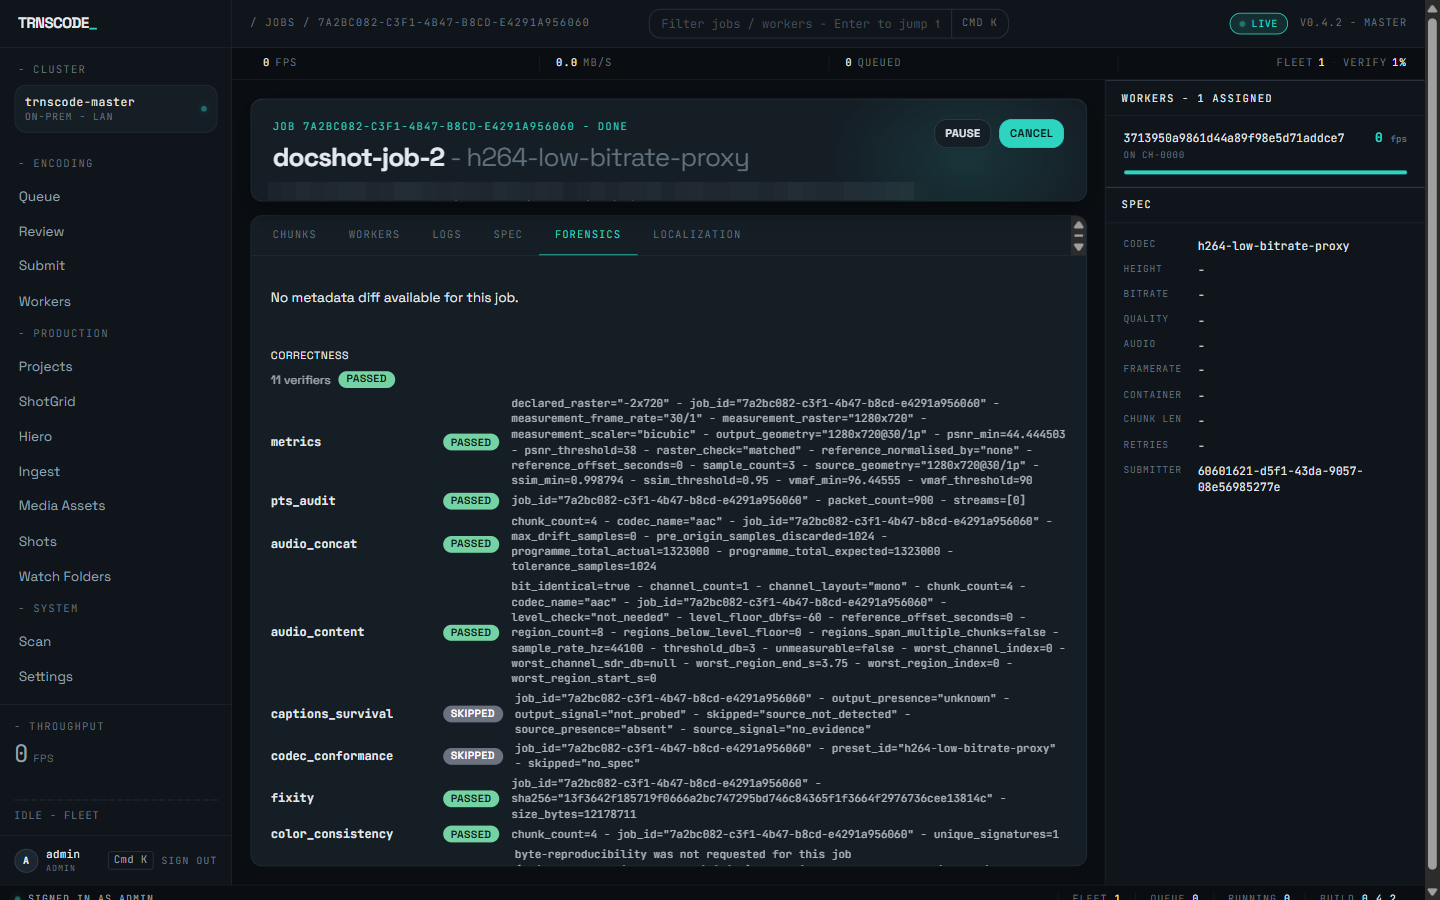
In the example, the metrics row records the measured floors — PSNR 44.44 against a threshold of 38, SSIM 0.9988 against 0.95, VMAF 96.45 against 90 — the timing audit records the 900 packets it walked, and the audio verifiers record expected versus actual sample totals. The two skipped rows state why they could not run: no captions were detected in the source, and the preset carries no codec-conformance specification.
Interpreting results#
- Passed — the verifier ran and was satisfied. The values shown are the evidence.
- Skipped — the verifier could not run, with the reason stated. Not a failure and not a pass: no evidence either way.
- Failed — the verifier ran and was not satisfied. On a completed job this is information to weigh before shipping, because correctness verifiers report rather than gate.
To package this evidence for support, run master support-bundle --job <ID> on the master. It works even when the console does not. See the CLI reference.
Delivery report#
The Forensics tab has a Delivery report button. It opens a single, self-contained HTML page that renders the same evidence — the correctness verifiers, the QC checks, the metadata comparison and the lineage — as one document suitable for handing to a client with the deliverable. Every check that did not run appears as a grey not measured row with its reason, so the report never implies coverage it does not have.
The same report is written automatically as a sidecar beside the finished file — a .report.html next to the deliverable — so the delivery package carries its own record. Print it to PDF from the browser when a fixed document is required.
It is a report, not a certificate: it states what was measured and what was not, and does not assert compliance with a standard.
Event drawer detail#
The same evidence surfaces as events. Selecting an entry in the activity feed opens a drawer rendered for that event type — job, chunk, worker, correctness, QC, localization, MAM, watch-folder and Flow events each render as a readable account with the relevant measured values, not a raw payload. A correctness or QC event opens directly to the figures the verifier recorded.
Use the Forensics tab when the question is about one job; use the event drawer when the question is about when something happened, or about events that belong to no single job — a worker approval, a watch-folder pickup, a Flow write-back.